From the desk of Colleen Volheim, category and research analysis manager
Heat mapping is a great tool to help build your case for deserving shelf space. Using sales data (in units or dollars), heat mapping highlights the top-selling products in a section or department. It’s a vibrant, visual way to depict the products that are attracting customer attention.
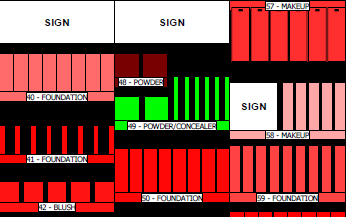
Our team has applied heat mapping to help our manufacturer clients understand how their brands were performing at new retailers. The analysis can be done at the segment, tray, or product level depending on the detail desired. When done at the segment level, you’ll be able to see how competing products compare, which can then be used to build in-store marketing strategies.
Heat-mapped planograms include a key to show the range of dollar sales within a segment so performance can be viewed from all angles — the high-, mid-, and low-selling items — to determine if there are placement correlations. Retailers can use heat maps to justify moving brand blocks within a section to see if location makes a difference to unit movement or to verify that customers find favored products no matter where they are moved within the section.
If you’re looking for a different perspective to analyze performance within stores or are looking for more data to build your brand story, heat mapping is an effective tool to try. What challenges are you facing? Contact us, we can help you continue to impress your retail partners.